Market Analysis · March 2026
Prepared exclusively for
Ben & Julie Thomas
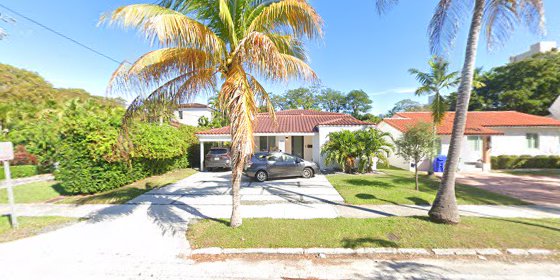
365 SW 31st Road
Miami, Florida 33130
The Roads · Private Residence
Scroll to explore


I'm a full-time real estate professional based in Coral Gables, proudly serving the greater Miami and Miami Beach area. I specialize in luxury homes, new construction, relocations, and income-producing investment properties — with a deep focus on helping clients make smart, strategic decisions that align with their lifestyle and financial goals. Licensed since 2018 with roots in the business that go back even further, I combine deep local market knowledge with a modern, data-driven approach — and a marketing engine that puts your home in front of the right buyers.


The following comparable sales represent the most relevant recent transactions in The Roads and surrounding Brickell corridor. Sales from October 2025 through March 2026 reflect current buyer demand and market velocity.
| Property | Status | Bed / Bath | Living Area | Lot | Sale Date | Sale Price | $ / sq ft |
|---|---|---|---|---|---|---|---|
| Subject 365 SW 31st Rd, Miami 33130 | — | 4 / 3.5 | 2,514 sq ft | 7,450 sq ft | — | — | — |
| 261 SW 30th Rd, Miami 33129 | Sold | 4 / 3 | 2,614 sq ft | 7,000 sq ft | Oct 15, 2025 | $1,725,000 | $660 / sq ft |
| 420 SW 19th Rd, Miami 33129 | Sold | 3 / 3 | 3,178 sq ft | 6,750 sq ft | Dec 2, 2025 | $1,850,000 | $582 / sq ft |
| 3001 SW 4th Ave, Miami 33129 | Sold | 4 / 3 | 3,049 sq ft | 7,500 sq ft | Mar 10, 2026 | $1,940,000 | $636 / sq ft |
Enters above recent comparable sales to capture upside if move-in-ready inventory under $2M in this size remains tight. The Roads has seen strong demand and limited supply — this positions the home at a premium justified by the 4/3.5 configuration, 2021 addition, 2020 pool, and larger lot.
Aligned directly with the most recent comparable sale — 3001 SW 4th Ave, a 4/3 that closed at $1,940,000 on March 10, 2026. Pricing here positions the home competitively from day one, attracting the broadest buyer pool and reducing the risk of prolonged market exposure.
The largest buyer segment — roughly 40% — enters 5–10% below asking. Both strategies are designed to land final negotiated terms in the $1,750,000–$1,850,000 range, where buyer depth is strongest. Strategy A creates more room to negotiate; Strategy B creates more speed and certainty.
Whether you're selling for the first time or the fifth, having a clear picture of what's ahead reduces stress and puts you in control. Here's what to expect from listing day through closing.
Figures below are based on an estimated negotiated sale price of $1,850,000, with a projected June 2026 closing. All figures are estimates — your final net sheet will be prepared at contract.
| Estimated Sale Price (negotiated) | $1,850,000 |
| Less: Agent Commission (negotiated, est. 5%) | ~$92,500 |
| Less: Documentary Stamp Tax (0.6% of sale price) | ~$11,100 |
| Less: Title / Settlement Fees | ~$1,750 |
| Less: Prorated Property Taxes (Jan – June, ~5.5 months) | ~$10,542 |
| Less: Estimated Mortgage Payoff † | ~$618,000 |
| = Estimated Net to Seller | ~$1,116,108 |
† Mortgage Payoff Estimate: Based on a ~$700,000 original loan balance at 3% (30-year fixed), consistent with a monthly P&I payment of ~$2,950. After approximately 5 years (60 payments), the remaining balance is estimated at ~$622,000. With approximately 3 additional payments to a June closing, the estimated payoff is ~$618,000. The loan has paid down roughly $82,000 in principal to date. Your actual payoff figure must be confirmed directly with your lender.
Capital Gains: Florida has no state income tax. Federal capital gains may apply — consult your CPA. If the home qualifies as your primary residence (lived in 2 of the last 5 years), you may be eligible to exclude up to $500,000 in gains (married filing jointly) under IRS §121.
We start by getting your home ready to impress. This includes a staging consultation, decluttering recommendations, minor repair suggestions, and scheduling professional photography. The goal: your home looks its absolute best before a single buyer steps through the door.
Once photography is complete, your listing goes live on the MLS and every major portal — Zillow, Realtor.com, Redfin, and more. Your social media campaign launches, email blasts go out to my buyer database, direct mailers are sent, and paid digital advertising begins targeting qualified buyers in your price range.
Qualified buyers and their agents schedule private showings. You'll receive weekly feedback reports and market updates. I track showing activity, buyer interest, and competing listings so we can make informed, real-time decisions.
When an offer comes in, we review every detail together — not just the price, but the terms, contingencies, financing strength, and closing timeline. I'll advise on counter-offer strategy and help you evaluate multiple offers side-by-side.
Once an offer is accepted, both parties sign the contract. The buyer submits their escrow deposit (typically 3% of the purchase price) within 3 business days. All required property disclosures are delivered to the buyer. Contingency periods begin.
Florida contracts include a 10–15 day inspection period. The buyer's inspector evaluates the property; any repairs or credits are negotiated. Simultaneously, the buyer's lender orders an appraisal. If the property appraises at or above the sale price, the financing contingency is cleared.
The title company conducts a full title search to verify ownership and identify any liens or encumbrances. A title commitment is issued, and the closing disclosure is prepared — showing you a full breakdown of all credits, debits, and your estimated net proceeds.
Both parties sign closing documents at the title company. The buyer's funds are wired in, the loan is funded, all parties are paid, and the deed transfers. Once funding is confirmed, you hand over the keys. Congratulations — you've closed.
Moving to Seattle raises a real question: sell and walk away with your equity, or hold the property as a rental investment? Below is an honest financial comparison to help you think it through. All figures are estimates — consult your CPA and financial advisor before making any decision.
Comp range: $8,500–$9,500/month. Your 4-bedroom, 3.5-bath home with pool and 2,514 sq ft is larger and better-appointed than all three comps — a conservative rental estimate of $9,000/month is well-supported by the market, with upside potential to $9,500.
| Estimated Sale Price (negotiated) | $1,850,000 |
| Less: Commission (est. 5%) | –$92,500 |
| Less: Doc Stamp Tax (0.6%) | –$11,100 |
| Less: Title / Settlement Fees | –$1,750 |
| Less: Prorated Taxes (Jan – June) | –$10,542 |
| Less: Mortgage Payoff (est.) | –$618,000 |
| Estimated Net to Seller | ~$1,116,108 |
While the home qualifies as your primary residence, you may be eligible to exclude up to $500,000 in capital gains (married, IRS §121). Consult your CPA. Florida has no state income tax.
| Gross Rent (12 months at $9,000/mo) | $108,000/yr |
| Less: Vacancy (5% of gross) | –$5,400/yr |
| Less: Re-rental Commission (1 month, annual re-lease) | –$9,000/yr |
| Less: Principal & Interest | –$35,400/yr |
| Less: Property Taxes (est. w/ loss of homestead, +10%) | –$25,300/yr |
| Less: Insurance (investment property, +15%) | –$14,950/yr |
| Less: Pool + Yard Maintenance | –$3,600/yr |
| Less: General Maintenance (est.) | –$4,000/yr |
| Less: Property Management | –$1,000/yr |
| Net Annual Cash Flow | ~$9,350/yr (~$779/mo) |
When homestead exemption is lost, property taxes typically increase ~10%. Investment property insurance typically runs ~15% higher. Current PITI (P&I + taxes + insurance) is ~$5,950/month — estimated to rise to ~$6,350/month after the transition. Note: Rental income also generates landlord tax deductions — mortgage interest, property taxes, depreciation, insurance, and maintenance are all deductible, which can meaningfully reduce your taxable rental income. Consult your CPA for specifics.
Per IRS Publication 523 (§121(b)(4)), you do not completely lose the $500,000 exclusion (married, filing jointly) when converting to a rental — but it is proportionally reduced. Any gain allocated to the "nonqualified use" period (the rental years) is NOT eligible for exclusion; only gain from the primary residence years remains protectable. Example: after 5 years of renting, only 50% of gain would be eligible for the exclusion. Additionally, any depreciation claimed during the rental period is subject to 25% recapture tax and cannot be excluded under any circumstance. Selling NOW captures the full exclusion on all qualifying gain. Source: IRS Publication 523.
Managing a rental from Seattle introduces real complexity: tenant turnover, maintenance surprises, city compliance, and emergencies all require attention. A property manager increases cost and will manage most situations, but it doesn't eliminate the risk. Even with ideal tenants, owning a rental cross-country is rarely as passive as it sounds.
At ~$779/month in projected cash flow, your annual cash-on-cash return on more than $1.1M in equity is under 1%. That same capital, invested in a diversified index fund, has historically returned 8–10% annually — significantly more, with full liquidity and no management overhead.
Rental ownership does come with meaningful write-offs: mortgage interest, property taxes, insurance, maintenance, management fees, pool, yard, and depreciation (the building value spread over 27.5 years) are all deductible against rental income. Depreciation alone on a property like this could offset $50,000–$60,000+ in paper losses annually — which can significantly reduce your taxable rental income, and in some cases create a net paper loss even with positive cash flow. Consult your CPA about passive activity loss rules.
If Miami property values appreciate faster than 4% annually — which is plausible given continued population growth and inventory constraints — the math starts to shift. If appreciation runs 6–7%, renting becomes more competitive. The decision ultimately comes down to your confidence in Miami's long-term trajectory, your appetite for complexity from Seattle, and the tax timing discussed above.
The financial math leans toward selling now — primarily because selling while the home still qualifies as a primary residence maximizes the §121 capital gains exclusion, and because the opportunity to redeploy $1.12M into higher-returning investments is meaningful. The rental scenario does generate positive cash flow (~$779/month), but the return on $1.1M+ in equity is modest. The larger risk of renting is what happens at the eventual future sale: capital gains tax on the rental-period portion of appreciation, plus depreciation recapture, will meaningfully reduce net proceeds. That said, if Miami appreciates faster than projected and the tax write-offs are used effectively, keeping the property isn't irrational — it just carries more complexity for a Seattle-based owner. All figures are estimates. Consult your CPA and financial advisor before making a decision.
† 5-year rental scenario capital gains estimate assumes ~$875,000 purchase basis, 5 years of depreciation (~$273,000 on building value), 50% nonqualified use fraction (5 rental years / 10 total years), partial §121 exclusion applied, and 23.8% federal LTCG rate + 25% depreciation recapture. Source: IRS Publication 523, IRC §121(b)(4). These are projections only — actual tax liability depends on purchase price, improvements, exact depreciation claimed, and individual tax situation.
Here's what happens next. From signed agreement to sold — every step is handled with precision, transparency, and your goals at the center.
We formalize our partnership and set the official list price, terms, and timeline.
Photography, staging consult, MLS entry, and full marketing campaign activated — all within days.
I handle every offer, every negotiation, every detail — from accepted offer to keys exchanged.